 AEO Engine
Nursery Stickers Case Study
How a UK nursery wall sticker retailer grew organic and AI-assistant visitors more than 14x in twelve months and lifted organic revenue 534% on the Growth plan.
Between the July 2025 baseline and the October 2026 reporting period, organic and AI-assistant visitors to nurserystickers.co rose from 509 to 7,233 per 28 days, organic revenue rose from $1,662 to $10,539, and AI assistant visitors rose from 4 to 306. Over the trailing twelve months, Plausible recorded 496,000 unique visitors from organic search, AI assistants and organic video.
Ecommerce, nursery decor
Jul 2025 baseline to Oct 2026 (trailing 12 months)
What changed for Nursery Stickers
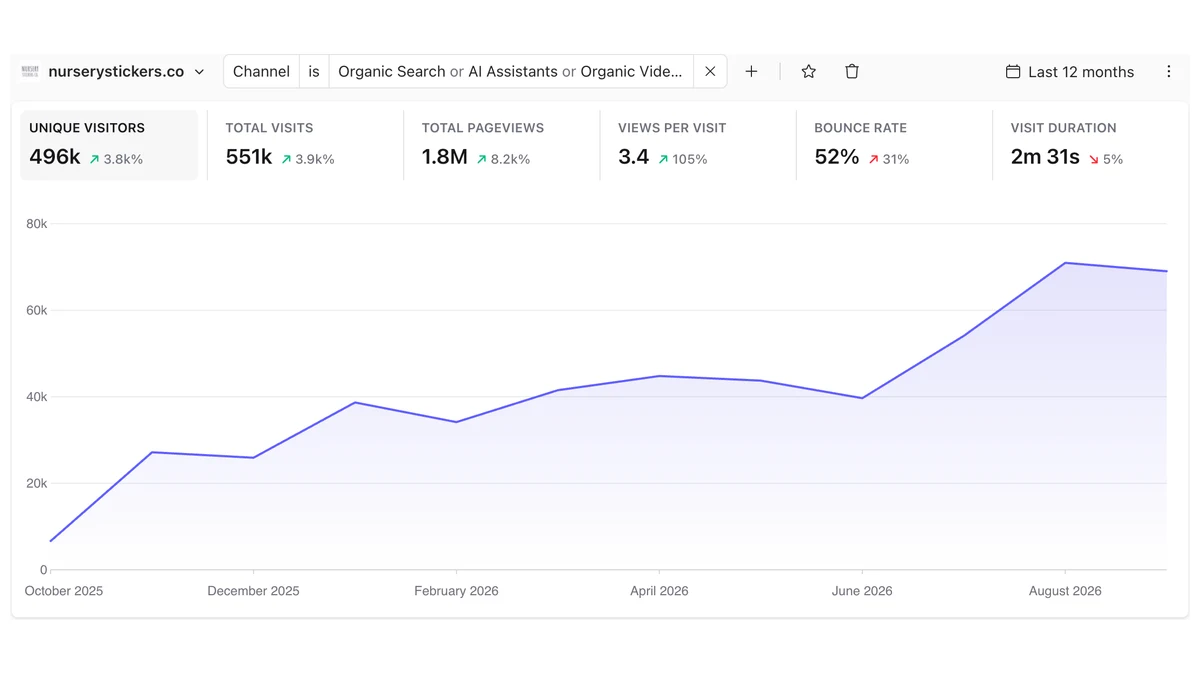
Over the trailing twelve months, Plausible recorded 496,000 unique visitors, 551,000 visits and 1.8 million pageviews from organic search, AI assistants and organic video. The monthly trend rose from roughly 5,000 visitors in October 2025 to roughly 70,000 by August 2026.
Against the July 2025 baseline, the current 28-day period shows visitors up from 509 to 7,233, pageviews up from 2,370 to 27,551, and revenue up from $1,662 to $10,539. That is 14.2x on visitors and 534.2% on revenue from the same period.
AI assistants contributed 306 visitors and 878 pageviews in the current period, up from 4 and 11 at baseline. Those visitors now make up about 4% of organic and AI traffic combined, which is the newest measurable channel in this account.
Conversion rate compressed as traffic scaled. Add to cart conversion fell from 64.05% to 25.51% and purchase conversion from 8.64% to 2.53%, because the audience moved from a handful of brand-ready visitors to a much broader top-of-funnel group. Revenue still grew 534.2% and average order value rose 52.5%, so the trade was volume and order size for rate.
This case study reports that conversion finding alongside the headline growth. A program that only publishes the multiple that grew cannot show what to fix next.
Data used in this case study
- AEO Engine weekly performance report for nurserystickers.co: 28-day periods compared against a July 2025 baseline
- Plausible Analytics: trailing 12 months filtered to organic search, AI assistants and organic video
- AEO Engine LLM traffic breakdown for AI assistant sessions
- Search position tracking for nursery furniture sets in the UK
The Results: 14x Organic and AI Traffic, 534% Revenue Growth
Visitors and revenue are compared against the July 2025 baseline in the weekly performance report. The 496,000 unique visitors figure comes from Plausible over the trailing 12 months and covers organic search, AI assistants and organic video combined.
What changed
The 28-Day Performance Window Against the July 2025 Baseline
The weekly performance report compares four rolling 28-day periods: the current period, the previous period, the period 90 days earlier, and the July 2025 baseline when the program started.
Every row below is from that report. Revenue is the bottom line and the reason the account reads as a growth story rather than a traffic story.
Traffic and revenue, 28-day periods
| Metric | Current | Previous | 90 days ago | Baseline (Jul 2025) | Change vs baseline |
|---|---|---|---|---|---|
| Visitors | 7,233 | 7,988 | 5,767 | 509 | +1,321.0% |
| Pageviews | 27,551 | 31,320 | 21,906 | 2,370 | +1,062.5% |
| Add to cart events | 1,845 | 1,924 | 2,521 | 326 | +466.0% |
| Add to cart conversion rate | 25.51% | 24.09% | 43.71% | 64.05% | -60.2% |
| Purchase events | 183 | 242 | 140 | 44 | +315.9% |
| Purchase conversion rate | 2.53% | 3.03% | 2.43% | 8.64% | -70.7% |
| Revenue | $10,539 | $12,703 | $8,221 | $1,662 | +534.2% |
Source: AEO Engine weekly performance report for nurserystickers.co, comparing 28-day periods against a July 2025 baseline.
Revenue is 6.3x the July 2025 baseline and traffic is 14.2x. The peak revenue period in this window was the previous 28 days at $12,703, so the current period is 17% below that peak while still 534.2% above baseline.
What the Evaluation Found: Traffic Scaled Faster Than Conversion
Add to cart conversion fell from 64.05% at baseline to 25.51%, and purchase conversion fell from 8.64% to 2.53%. Both declines are reported here rather than omitted, because they are the clearest signal about what the audience now looks like.
The baseline period carried 509 visitors and 44 purchases. A rate computed on that sample reflects a small, already-warm group, largely brand and returning traffic. The current period carries 7,233 visitors and 183 purchases, most of them arriving on a first visit from a search or an AI answer about a nursery theme they have not shopped before.
So the honest reading is not that the store converts worse. It is that the store now converts a much colder, much larger audience at a normal rate, and the revenue outcome is still 6.3x baseline because order value also rose 52.5%.
Conversion rates by period
| Rate | Current | Baseline | Change |
|---|---|---|---|
| Add to cart conversion | 25.51% | 64.05% | -60.2% |
| Purchase conversion | 2.53% | 8.64% | -70.7% |
| Average order value | $57.59 | $37.77 | +52.5% |
| Revenue per visitor | $1.46 | $3.27 | -55.4% |
Source: Derived from the weekly performance report. Average order value is revenue divided by purchase events; revenue per visitor is revenue divided by visitors.
Revenue per visitor fell from $3.27 to $1.46 even as total revenue grew 6.3x. That is the number the next program is built around: the audience is now large enough that a small gain in conversion or order value produces more revenue than the last year of traffic growth did.
AI Assistant Traffic: 4 Visitors a Month to 306
AI assistants are the newest channel with a measurable baseline in this account. The report tracks sessions that arrive from AI assistants separately from classic organic search, which makes it possible to see the channel opening rather than inferring it.
AI assistant visitors grew from 4 at baseline to 306 in the current period, a 76.5x increase, and pageviews from 11 to 878. Those sessions produce 2.9 pageviews per visitor, close to the site-wide 3.8, so the traffic behaves like real shopping behaviour rather than a bot artifact.
AI assistant traffic, 28-day periods
| Metric | Current | Previous | 90 days ago | Baseline | Change vs baseline |
|---|---|---|---|---|---|
| Visitors | 306 | 361 | 100 | 4 | +7,550.0% |
| Pageviews | 878 | 1,233 | 290 | 11 | +7,881.8% |
| Share of organic and AI visitors | 4.2% | 4.5% | 1.7% | 0.8% | +3.4 pts |
Source: AEO Engine LLM traffic breakdown, current 28-day period against the July 2025 baseline.
The share of traffic arriving from AI assistants has grown from under 1% to about 4%. That is small in absolute terms and it is the channel most likely to reprice a category like nursery decor, where buyers ask an assistant for themes and ideas before they ever type a product query.
Client Context
Nursery Stickers, trading as The Nursery Sticker Company, sells wall stickers for babies rooms, children rooms and playrooms direct at nurserystickers.co. The catalogue covers animal stickers, rainbows, polka dots and personalised designs, and the product is deliberately rental friendly: easy to apply, cleanly removable.
That shape matters for search. Buyers do not arrive knowing the brand. They arrive with a room to finish and a theme in mind, often while pregnant or moving house, and they ask broad questions about nursery themes, wall decor for renters, and which stickers will not damage paint.
The commercial goal was to own those theme and room questions, then route the buyer into a design they can buy the same day.
The Ecommerce Search Problem
A decor store competes on two surfaces at once, and they reward different work.
Classic organic search rewards a deep catalogue of specific pages: one per theme, one per room type, one per buyer question. AI assistants reward something narrower. They cite a page that answers a question completely and in quotable terms, which usually means plain statements about what a product is, who it suits, how it is applied and whether it damages paint.
At baseline the store had very little of either. The site did not carry the surface area to rank for the way buyers describe a nursery, and it did not carry the concrete product detail an assistant needs to recommend a specific sticker set.
- •Nursery decor is seasonal and milestone driven, so demand concentrates around pregnancy, house moves and room refreshes rather than spreading evenly.
- •The category is visually competitive. Listings look alike, so the differentiators that win a click are specifics: removable, rental safe, application time, size, and personalisation.
- •Ecommerce revenue attribution needs the checkout funnel kept intact, and conversion rates move for reasons that have nothing to do with traffic quality.
- •AI assistants were a real but tiny channel, small enough that any change had to be measured against a genuine baseline rather than a rounding error.
Goals
Build theme and room coverage
Publish the pages buyers actually search for: the themes, rooms and renter constraints that precede a nursery decor purchase.
Grow organic revenue, not just sessions
Treat revenue and purchase events as the headline, with visitors as the leading indicator rather than the result.
Open the AI assistant channel
Establish a measurable baseline for sessions arriving from AI assistants, then grow the pages those sessions land on.
Keep the funnel honest
Report conversion rate and revenue per visitor alongside growth, so a traffic win cannot hide a funnel problem.
How AEO Engine Built the Growth System
Mapped nursery themes and rooms to buying intent
We built the content plan around how buyers describe a nursery rather than how a catalogue is organised: by theme, by room, by age, and by the constraint that decides the purchase for renters.
- Theme clusters covering animals, rainbows, polka dots and personalised designs
- Room and age framing for babies rooms, children rooms and playrooms
- Renter-focused angles built on removable application and clean removal
Published at a steady weekly cadence
The account now ships content weekly, with 14 articles published in a single reported week. Cadence matters here because coverage is the mechanism: each page opens a new set of questions the store can be found for.
- Weekly publishing rhythm tracked in the performance report
- Answer-first openings for the question in the title
- Internal links from theme and room pages into the matching product collections
Wrote product detail an AI assistant can quote
Assistants recommend a specific product when a page states plainly what it is, who it suits, how it applies and what it does to the wall. That is a content problem before it is a technical one.
- Concrete product statements on size, application and removal
- FAQ blocks matched to the questions buyers actually ask
- Clear entity signals: brand, market, product type and room
Structured pages for extraction
Article, product and collection pages were structured so a crawler or an answer engine can identify the topic, the product and the retailer without guesswork.
- Schema markup and breadcrumbs across content and collection pages
- Consistent headings around theme, room, material and application
- Visible content and structured data kept in agreement
Measured organic and AI as separate channels
The weekly report separates AI assistant sessions from classic organic search and compares everything against a fixed baseline, so the AI channel could be read as it grew instead of being averaged away.
- Rolling 28-day comparisons against the July 2025 baseline
- AI assistant visitors and pageviews reported as their own line
- Funnel metrics tracked per period, not only at the top
The Plausible View: Twelve Months of Organic and AI Traffic
The weekly report measures short windows precisely. Plausible shows the shape of the year, filtered to organic search, AI assistants and organic video, which is the combined surface this program is built to win.
The monthly trend rose from roughly 5,000 visitors in October 2025 to roughly 70,000 by August 2026, with a flat stretch between December 2025 and February 2026 before the curve steepened through the spring and summer.
Trailing twelve months, organic search, AI assistants and organic video
| Metric | Value | Change |
|---|---|---|
| Unique visitors | 496,000 | +3,800% |
| Total visits | 551,000 | +3,900% |
| Total pageviews | 1,800,000 | +8,200% |
| Views per visit | 3.4 | +105% |
| Bounce rate | 52% | +31% |
| Visit duration | 2m 31s | -5% |
Source: Plausible Analytics for nurserystickers.co, channel filter: organic search, AI assistants, organic video. Last 12 months.
Bounce rate rose 31% and visit duration fell 5%, consistent with a much broader, colder audience arriving on first visits. That is the same signal as the conversion compression in the 28-day report, seen from a different angle.
Proof Stack
The proof below shows the four outcomes that mattered most: traffic scale, revenue growth, order value, and a measurable AI channel.
Organic and AI-assistant visitors grew from 509 to 7,233 per 28 days against the July 2025 baseline.
Source: AEO Engine weekly performance report
Organic revenue grew from $1,662 to $10,539 per 28 days over the same comparison.
Source: AEO Engine weekly performance report
Plausible recorded 496,000 unique visitors, 551,000 visits and 1.8 million pageviews in the trailing twelve months.
Source: Plausible Analytics, trailing 12 months
AI assistant visitors grew from 4 to 306 per 28 days and now make up about 4% of organic and AI traffic.
Source: AEO Engine LLM traffic breakdown
Average order value rose from $37.77 to $57.59, so each purchase is worth more than at baseline.
Source: Derived from the weekly performance report
Why This Account Is Harder Than It Looks
Nursery decor is a milestone purchase, not a recurring one. A customer buys a set for a room and then largely leaves the market, so the account has to keep finding new parents and new movers rather than growing by retention.
That makes coverage the growth mechanism. The store cannot win by optimising twenty product pages, because the demand is spread across themes, rooms and constraints, and each of those is a separate question with a separate answer.
It also means the conversion signal is easy to misread. When traffic grows 14x the funnel rate has to fall, and a report that only shows rate would make a successful year look like a decline.
- •Milestone-driven demand with little repeat purchase
- •Demand spread across themes, rooms and renter constraints rather than concentrated in head terms
- •Conversion rate falls mechanically as a broader audience enters, so the headline has to be revenue
- •AI assistants were measurable but tiny at baseline, so the growth had to be tracked against a real number
Why It Worked
The growth was not one viral page. It compounded month after month: roughly 5,000 visitors a month in October 2025, roughly 39,000 by February 2026, roughly 45,000 by April, and roughly 70,000 by August.
Two things made that possible. Coverage matched how buyers describe a nursery rather than how a catalogue is organised, and cadence kept opening new questions every week instead of stopping after a launch sprint.
The revenue result then depended on the second half of the system: pages specific enough that a buyer arriving with a theme in mind could find the matching design and buy it in the same session. Average order value rising 52.5% is the evidence that the traffic arriving was relevant rather than merely large.
- Topic coverage followed buyer language: theme, room, age and renter constraints.
- A weekly publishing cadence sustained, rather than a one-off launch sprint.
- Pages carried the concrete product detail an AI assistant needs before it will name a product.
- Organic search and AI assistants were measured separately, so the new channel was visible as it opened.
What We Would Do Next for Nursery Stickers
Four shifts, each aimed at a number on this page rather than at general best practice.
- →Convert the traffic already arriving: revenue per visitor fell from $3.27 to $1.46, so conversion and merchandising work now outranks new traffic.
- →Match assistance to intent: strengthen the 306 AI-assistant sessions a month with comparison and theme-answer pages the assistants can quote.
- →Rebuild the seasonal calendar: publish ahead of the pregnancy and house-move peaks instead of during them.
- →Hold the weekly cadence and report revenue per visitor alongside revenue, so a traffic gain cannot mask a funnel loss.
Four numbers to hold ourselves to
| Measure | Today | 12-month target | How |
|---|---|---|---|
| Purchase conversion rate | 2.53% | 3.50% | Merchandising, bundles, checkout friction |
| Revenue per visitor | $1.46 | $2.00 | Conversion plus order value |
| AI assistant visitors per 28 days | 306 | 750 | Comparison and theme answer pages |
| Add to cart conversion | 25.51% | 32.00% | Product detail and theme routing |
Source: Baselines are the current 28-day reporting period in October 2026. Each target is measured with the same method as its baseline.
Explore the system behind this result
These related AEO Engine resources explain the methodology used to build search visibility, AI citations, and qualified conversion paths.
FAQ: Nursery Stickers AEO Case Study
What was the main result for Nursery Stickers?
Against the July 2025 baseline, organic and AI-assistant visitors grew from 509 to 7,233 per 28 days, a 14.2x increase, and organic revenue grew from $1,662 to $10,539, a 534.2% increase. Over the trailing twelve months Plausible recorded 496,000 unique visitors, 551,000 visits and 1.8 million pageviews from organic search, AI assistants and organic video.
Is the revenue growth more than 10x?
Traffic is more than 10x. Visitors grew 14.2x against the July 2025 baseline. Revenue grew 534.2%, which is 6.3x, and the peak 28-day period in this window reached $12,703, or 7.6x baseline. The 10x-plus multiple is a traffic multiple, and this case study reports the revenue multiple at 6.3x rather than rounding it up.
Why did conversion rate fall if revenue grew?
Traffic grew 14.2x while purchase events grew 4.2x, so the rate had to fall. The baseline period converted 44 purchases from 509 visitors, largely brand and returning traffic, at 8.64%. The current period converted 183 purchases from 7,233 visitors, mostly first visits from search and AI answers, at 2.53%. Revenue still grew 534.2% because order value also rose 52.5%.
How much traffic comes from AI assistants?
AI assistants sent 306 visitors and 878 pageviews in the current 28-day period, up from 4 visitors and 11 pageviews at the July 2025 baseline. That is about 4.2% of all organic and AI visitors, up from under 1% at baseline.
What does AEO Engine do for an ecommerce store?
AEO Engine maps how buyers describe a category, publishes answer-first content at a weekly cadence across themes and use cases, structures product and collection pages so search engines and AI assistants can extract and quote them, links that content into the product catalogue, and reports organic search and AI assistant traffic separately against a fixed baseline.
What makes this an AEO case study rather than a traditional SEO case study?
It reports both surfaces with separate baselines. Traditional SEO reporting stops at sessions and rankings. This evaluation also tracks sessions arriving from AI assistants, now 4.2% of organic and AI traffic, and reports conversion rate and revenue per visitor so the growth can be read against what actually happened in the funnel.
How long did the growth take?
The program compares against a July 2025 baseline. Monthly organic and AI visitors rose from roughly 5,000 in October 2025 to roughly 70,000 by August 2026, with the steepest acceleration between February and August 2026.
Can this work for other ecommerce brands?
The system is repeatable: map the language buyers use, publish at a sustained cadence, put concrete quotable detail on product pages, structure everything for extraction, and measure organic and AI channels separately. Results depend on category breadth, existing authority, catalogue depth and how much product detail already exists on the site.
Want your store to grow organic and AI revenue like this?
Book a free AEO and AI visibility audit. We will show you which buying questions your store cannot be found for, how much traffic AI assistants already send you, and where the fastest revenue is in the funnel you already have.
- The themes and buying questions your category searches for that your store does not cover
- Your current AI assistant traffic, measured rather than guessed
- A 30/60/100-day plan for coverage, product detail, structured data and conversion
Limited to 5 new audits per month.
More Case Studies
Broadview Federal Credit Union
+341% search impressions and page two to page one for a $9B credit union
Read Case Study →Ecommerce ApparelOppoSuits
$751,779 revenue, 1,221 purchases and 1,339 AI citations
Read Case Study →Ecommerce AccessoriesSmartish
$338,469 attributed revenue and 2,802 AI citations
Read Case Study →EcommerceCornish Seaweed Bath Co
+248% organic traffic and +375% LLM traffic
Read Case Study →